2019 Review
I ain’t no Stephen Wolfram but I do try to time myself on any activities I do on my computer whenever possible. Mostly to validate (or train my mind) the time took to finish a task is not what I thought it would be. At times I pleasantly surprised, most often my estimates are always under estimated.
Above all I am fascinated with the concept of Time. My pastime includes watching the second hand move on the clock like the painting Man, Table, Fish by Micheal Sowa wondering how can I ever get that time back.
I have built this app called Timetracker to log my time on each activity during my day, this is mostly to help me keep me not distracted as it always stays on top all windows. It also helps me to get some rough estimate of time I spend. I still haven’t figure out how much time I actually spent in entirety, since these days I juggle with multiple machines (work and personal) and most of my learning for job happens on mobile.
Note: The data provided here is just an approximation, not all tasks are mutually exclusive and I was only interested in finding answers to few items. With all that asterisks, here is what I found out from my 2019 data.
Tasks vs Time
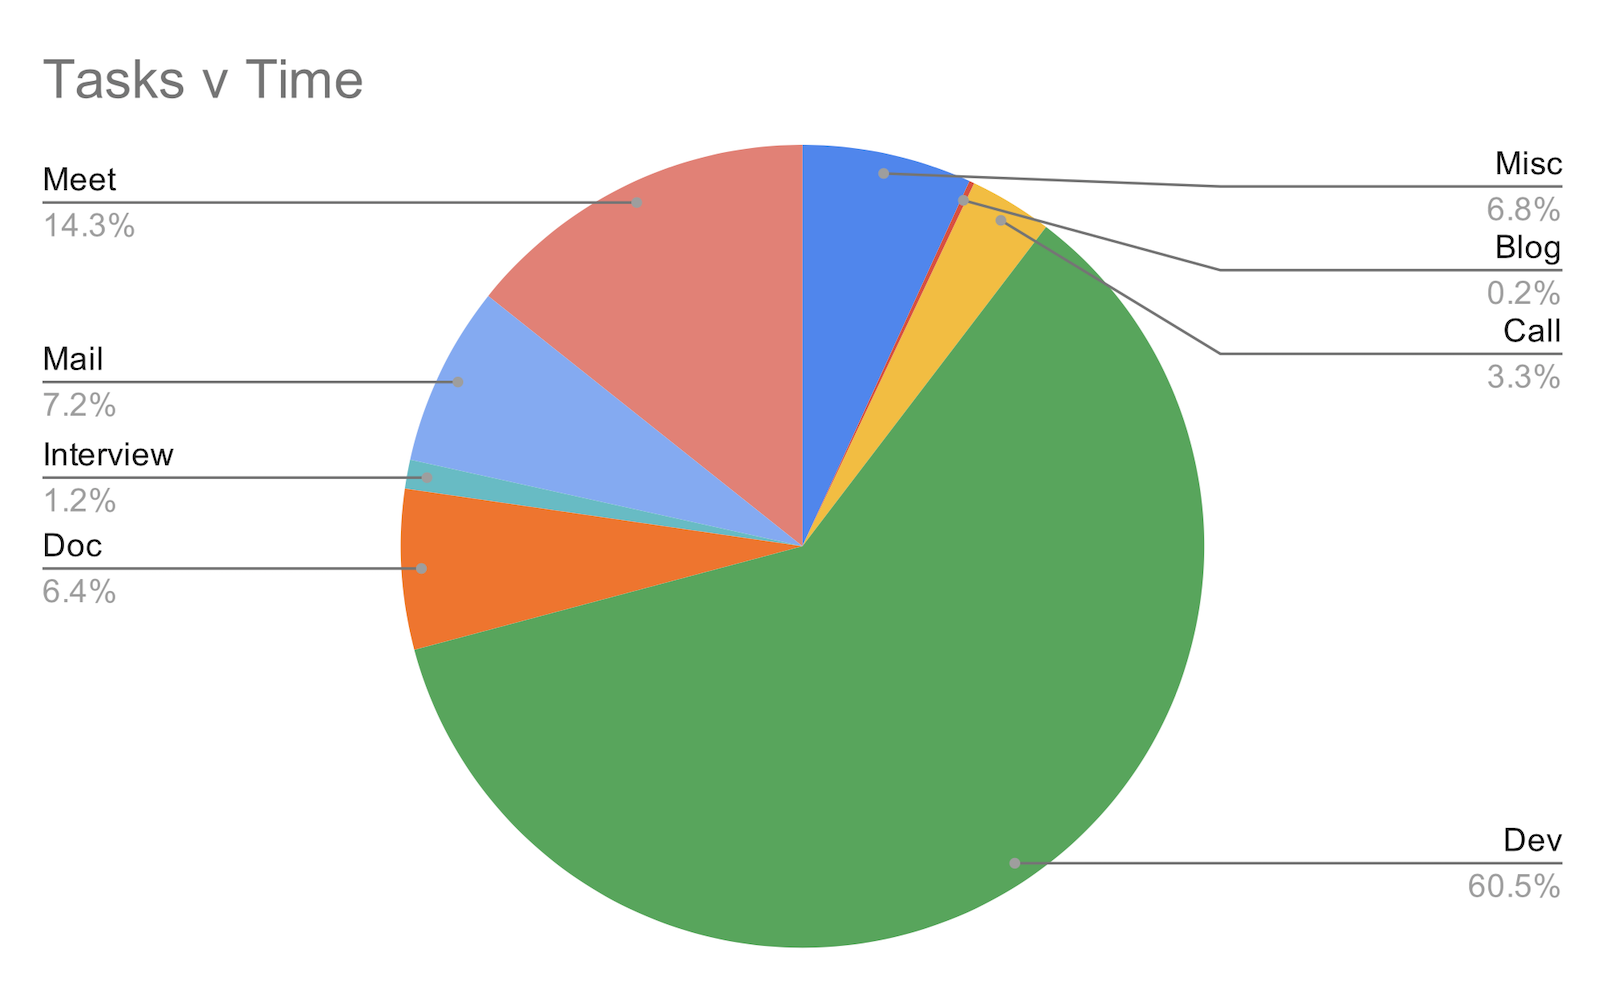
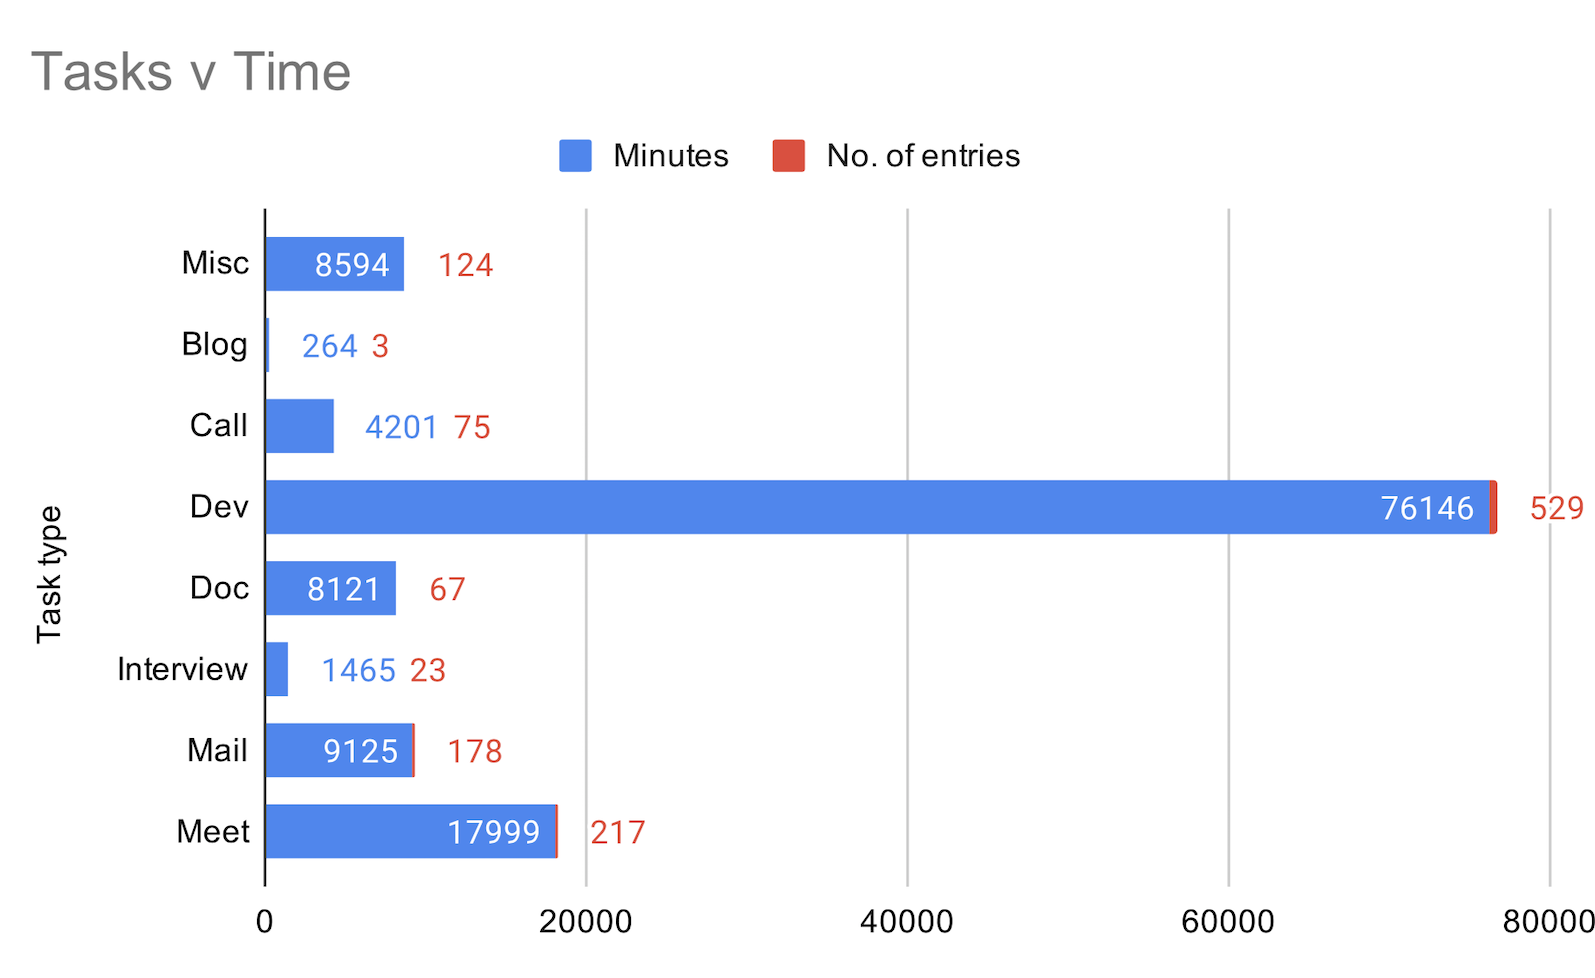
This is to check what kind of activity I do the most. I need to get my taxonomy right, so many typos and too few/many category.
- ~60% on Development
- ~14% on Meetings
- ~17% on Calls, documentation etc.,
No wonder I am kind of happy with the activity 2019, > 50% on development which I love the most. I think I didn’t spent that much time in previous year, and also on a same project.
Though it is ~10% on communication, it felt like 40% of my effort.
Tasks by Hour
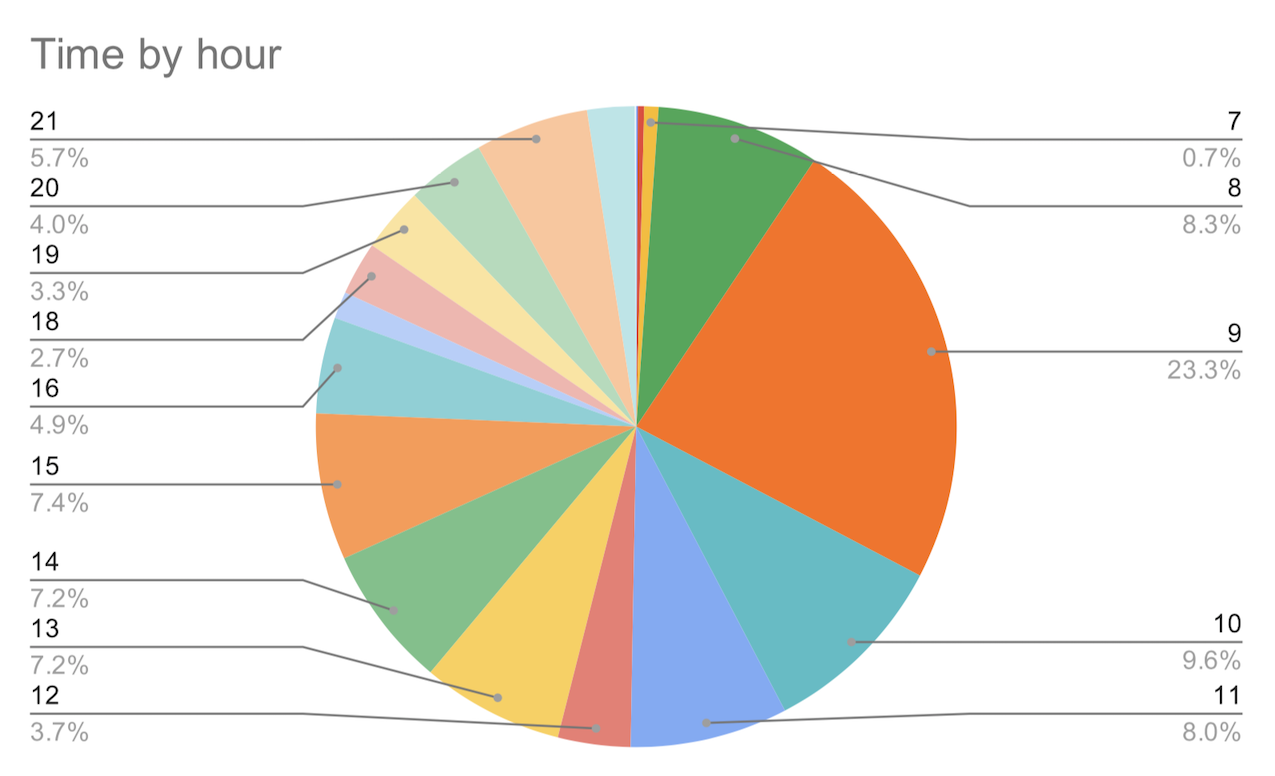
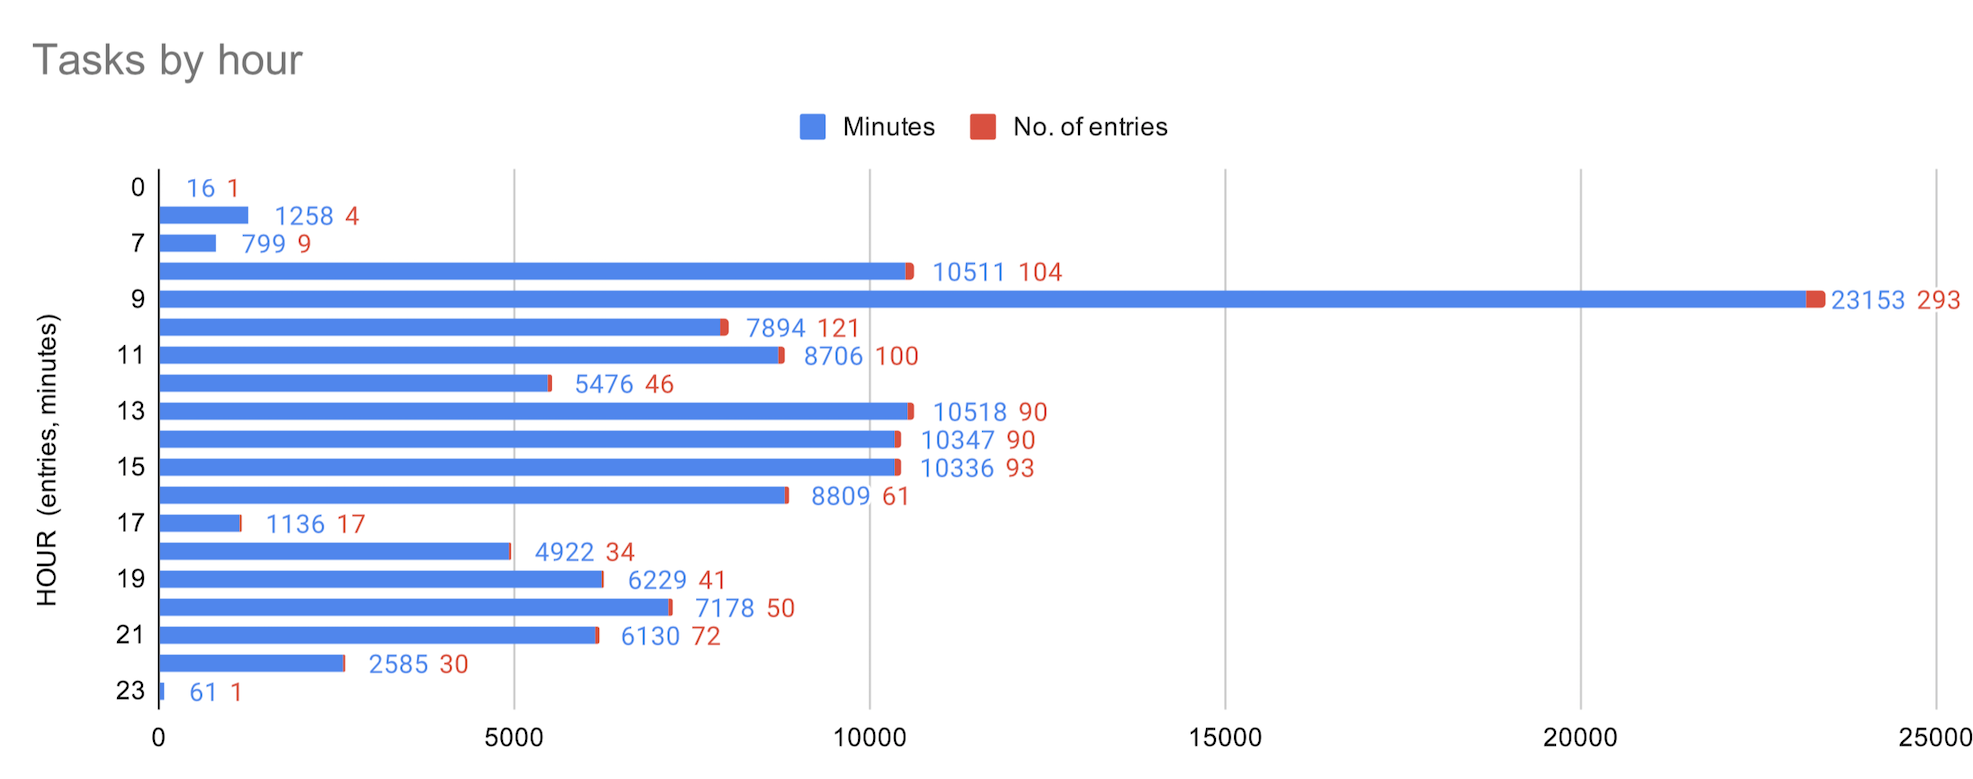
Who would have thought 9am as my peak hour. I converted to a morning person for unknown reasons, as not at home and relying on public transport on a foreign country I assume. I think only at home I feel secure and sleep till 8/9am or may be my age catching up and I can’t sleep like my past.
Enough blabbering, even though all my status calls between 8-9 I think I had started too many tasks at 9 consistently
Weekends
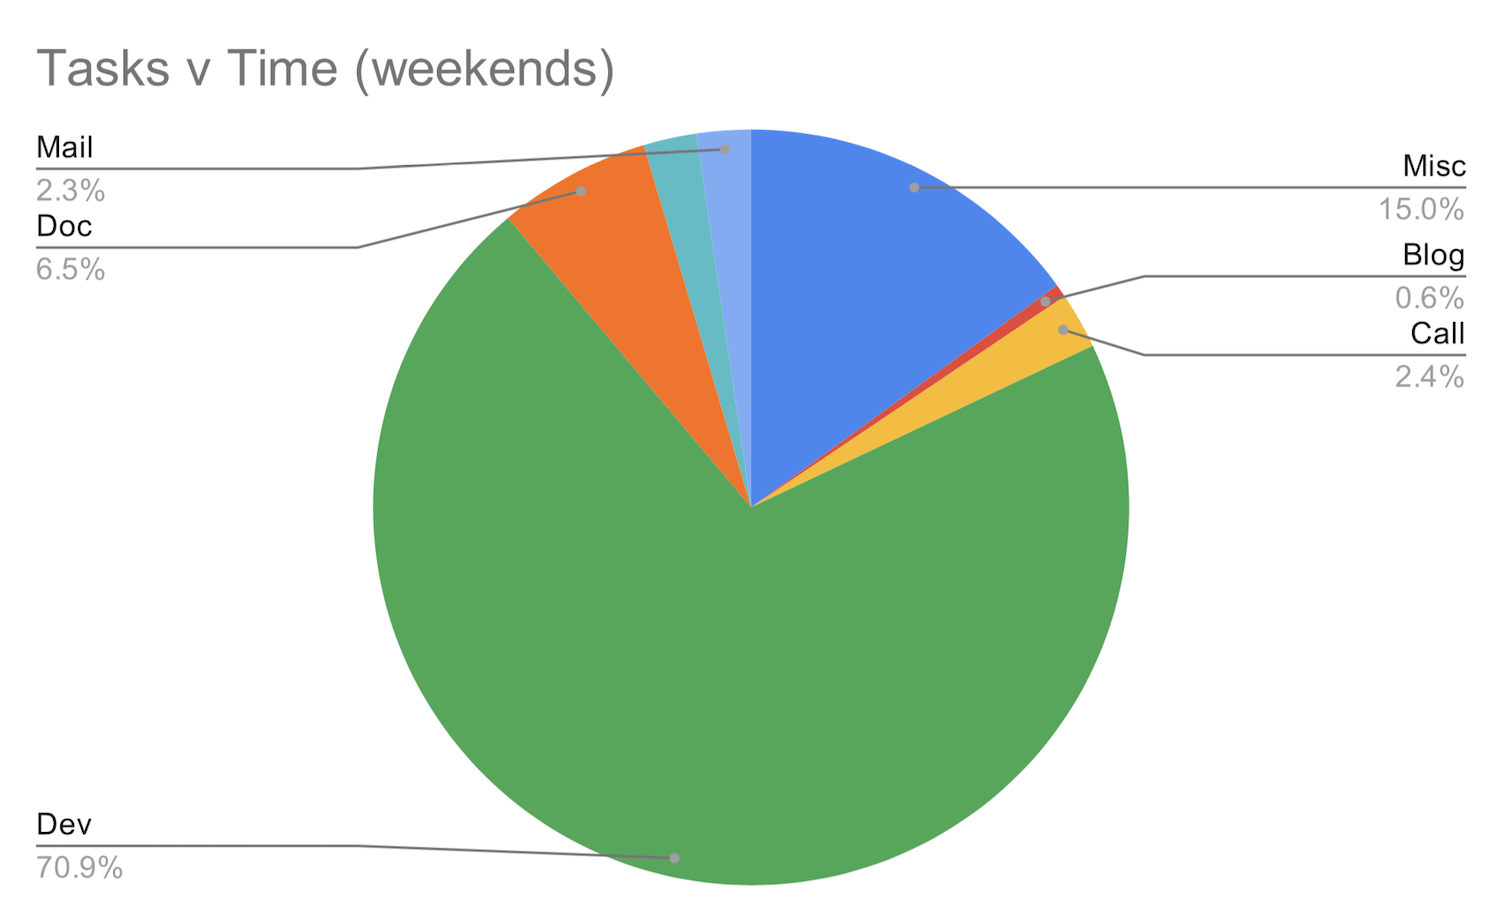
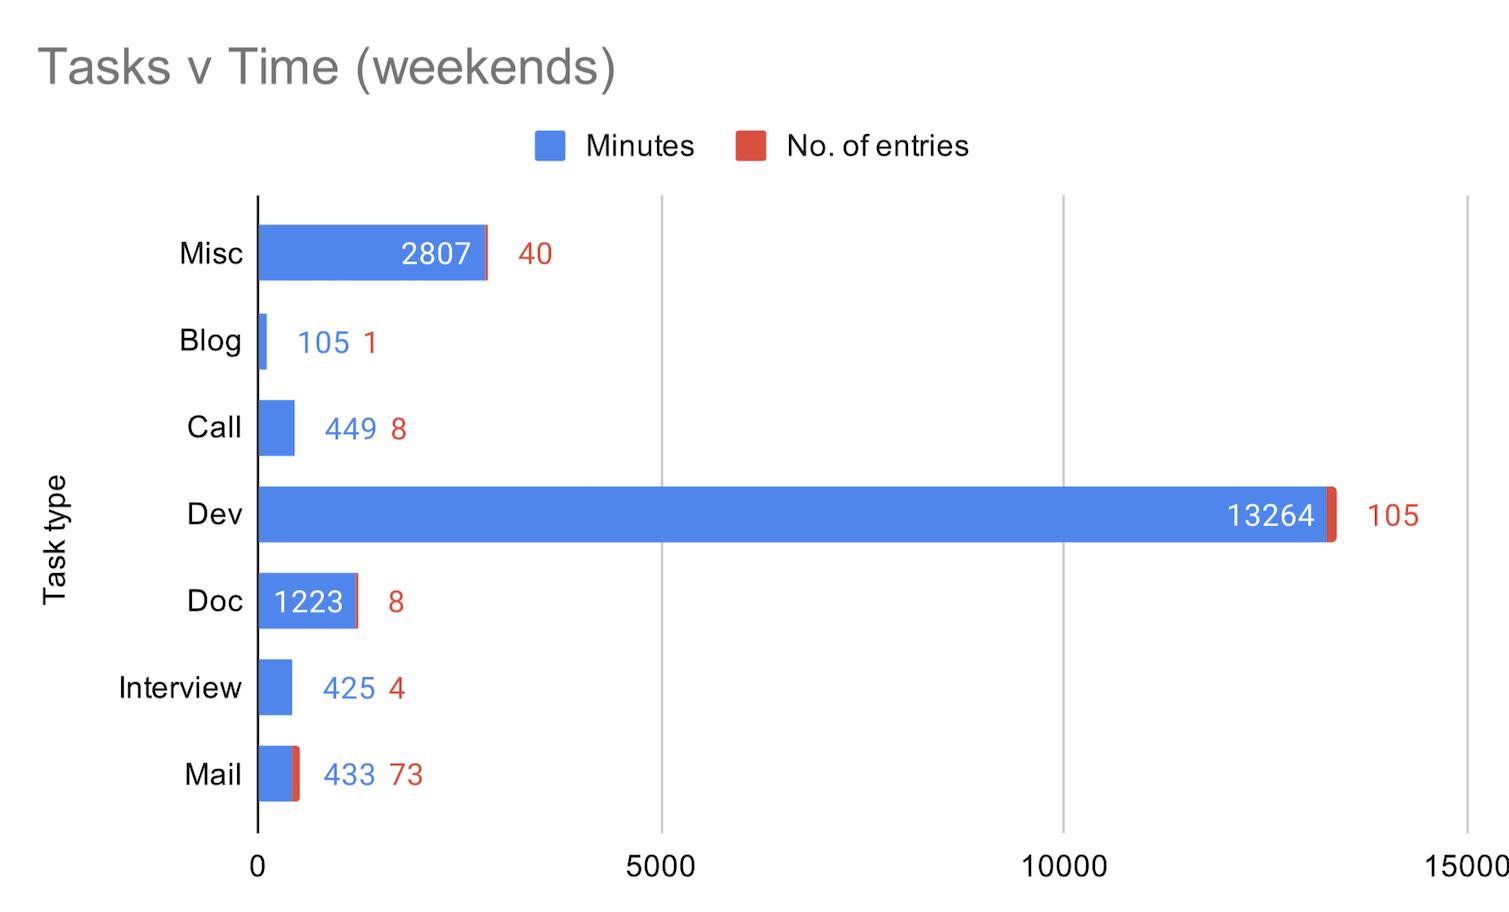
Though I am paid the minimum salary set by the country for the position, I still clocked so many hours during weekends. Off course, I am addicted to work or curious to figure out the solution?
Approximately ~70% effort on development and 105 unique activities. It is like 2 tasks every weekend for the whole year. Gosh, I should go out with my camera more or work on processing those. My org file agenda would scream at me if it ever read this line.
Hours at home
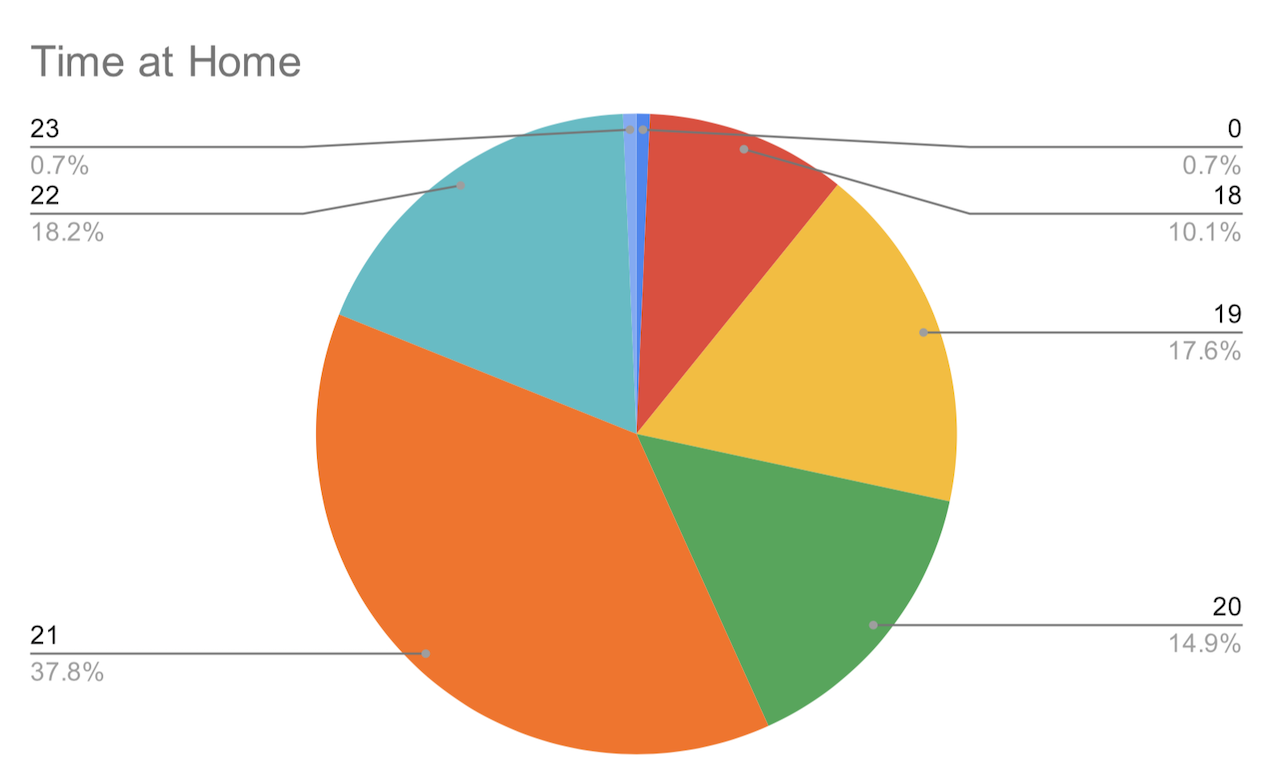
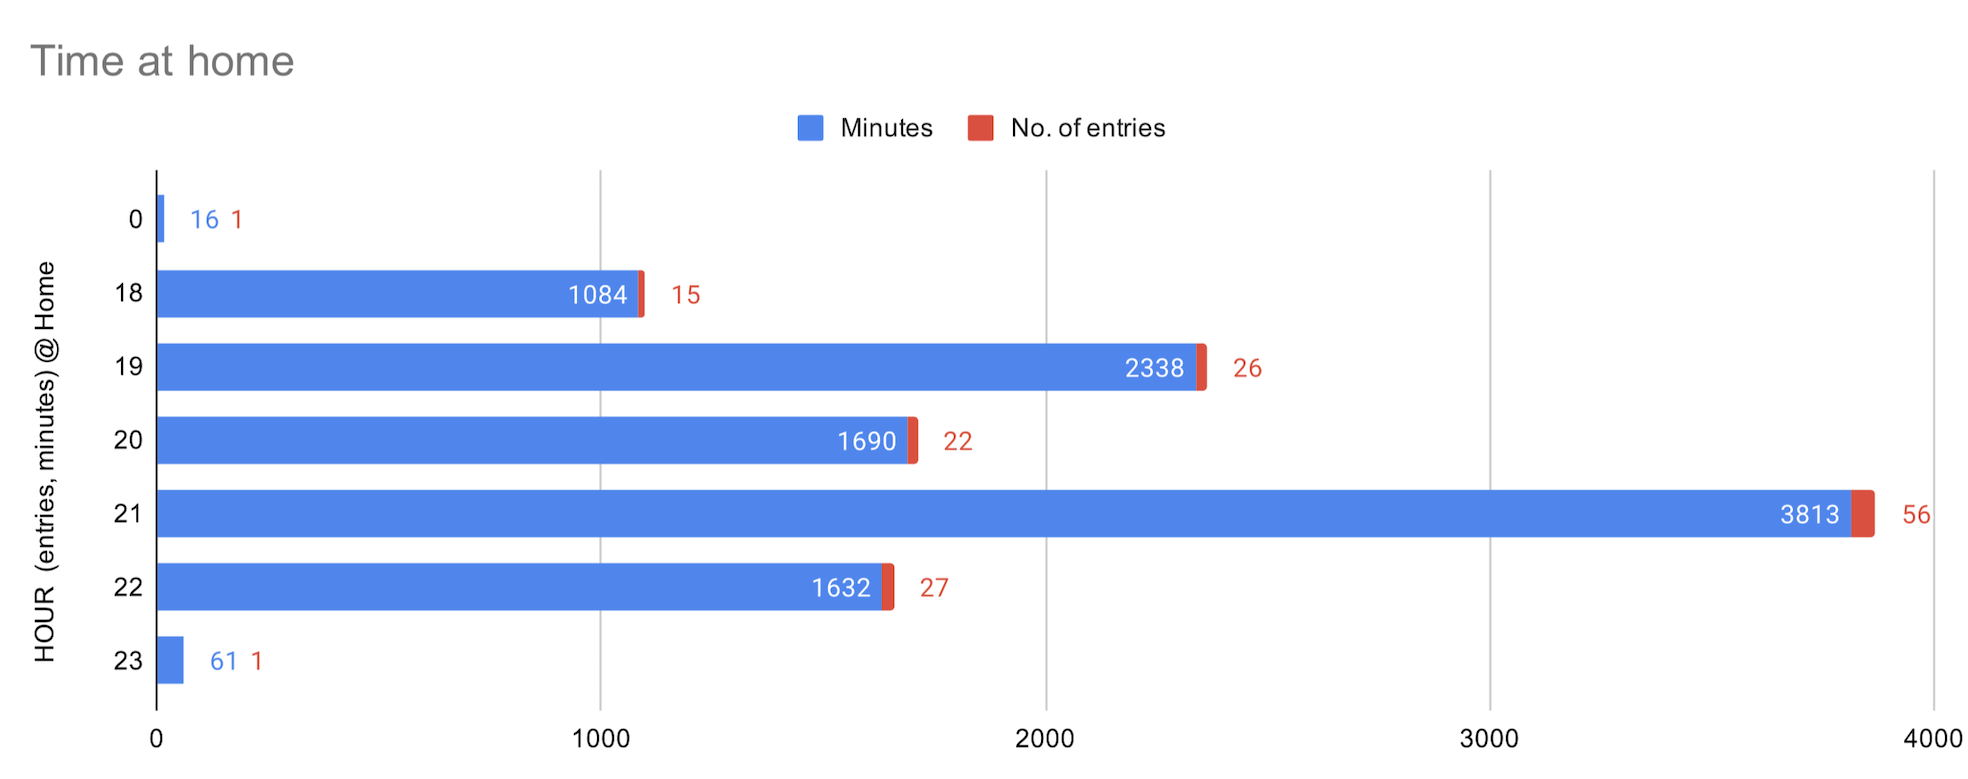
No surprise here, even on days where I reach home at 5, looks like I started work right away. (could be weekends, still). Even at 10pm I started like 27 tasks!
Work vs Home machine
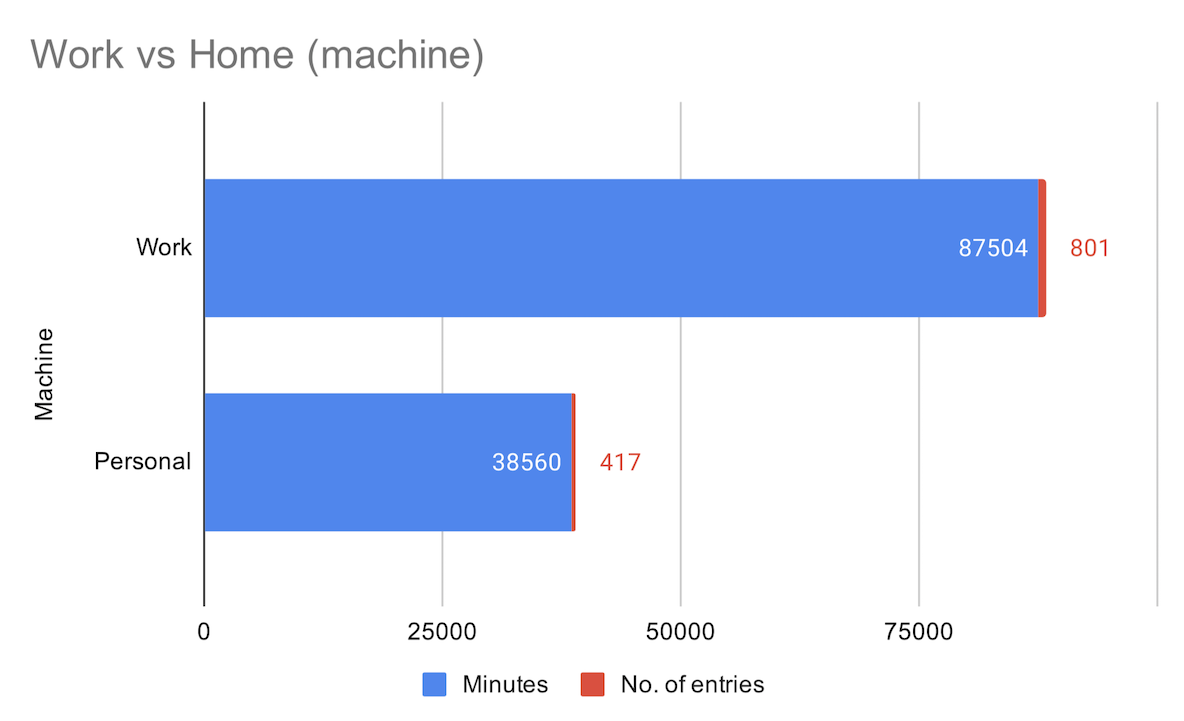
This is an odd report, but I just wanted to know how much time I spent on my personal machine which costs me as much as my car.
I had to use my personal machine for about a month since my employer issued laptop only after like 6 weeks. It is sad I had not used my machine much for my personal projects for an expensive laptop with f@$#@$ keyboard.
Misc. learnings
By processing these data I learnt few short comings of my app
- I saved dates only as UTC on my app and I moved to US during this year. So home time, summer and standard time to deal with. Had to manually add offset based on 3 different dates
- Due to lack of strict taxonomy I had to manually update many records
- Have at least the common reports automated
My 2017 report
Just for the sake of comparision, here is my old tweet with 2016/17 data. May be next year I’ll have it in jupyter notebook with pretty pyplot.
P.S:
Yes, it is already March 2020, as you know from the data presented I spent way too much time on work.
I think I forgot to get the 2018 data from my work machine before I returned. There is a remote possibility I would have taken realm export. I’ll update this post if I find the backup somewhere.